


Financial Highlights
FINANCIAL HIGHLIGHTS
Key Highlights
Income Statement
Balance Sheet
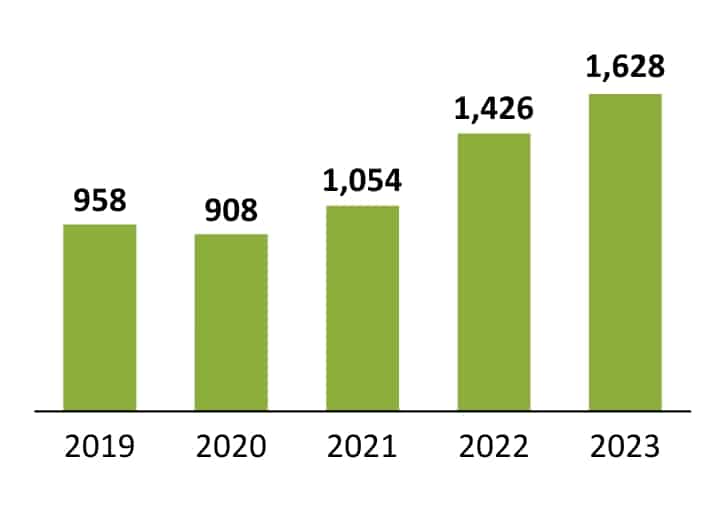
TURNOVER
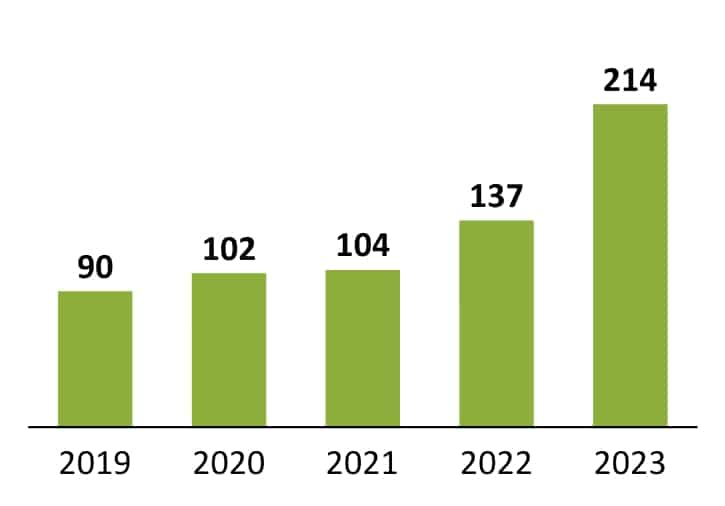
ADJUSTED EBITDA
EARNINGS BEFORE TAXES
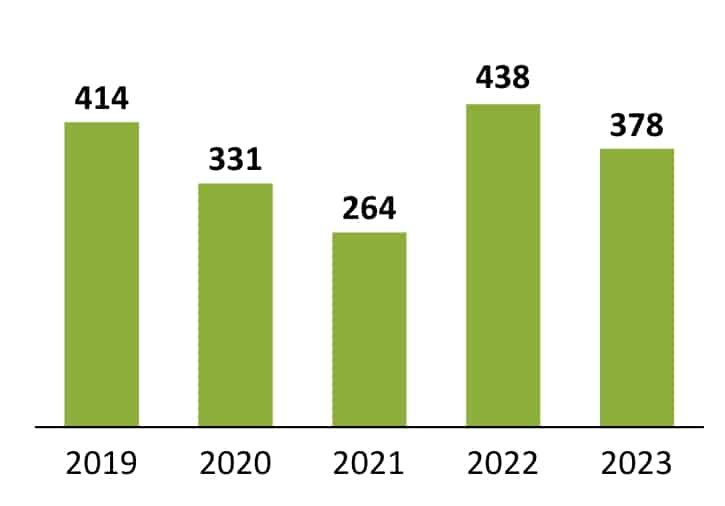
NET DEBT
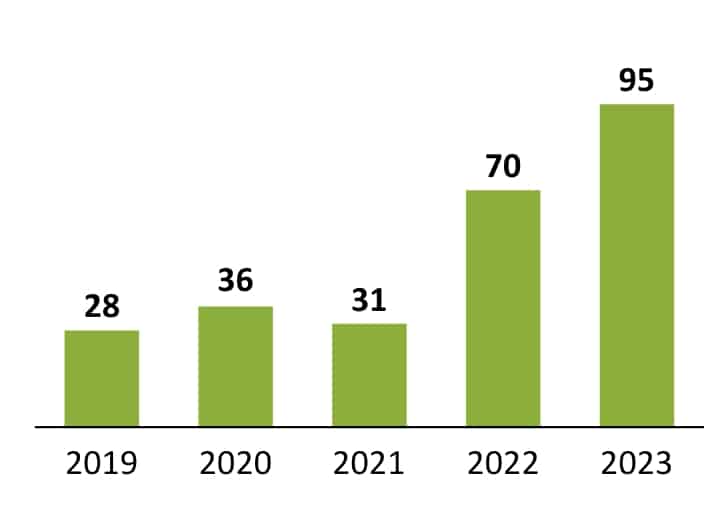
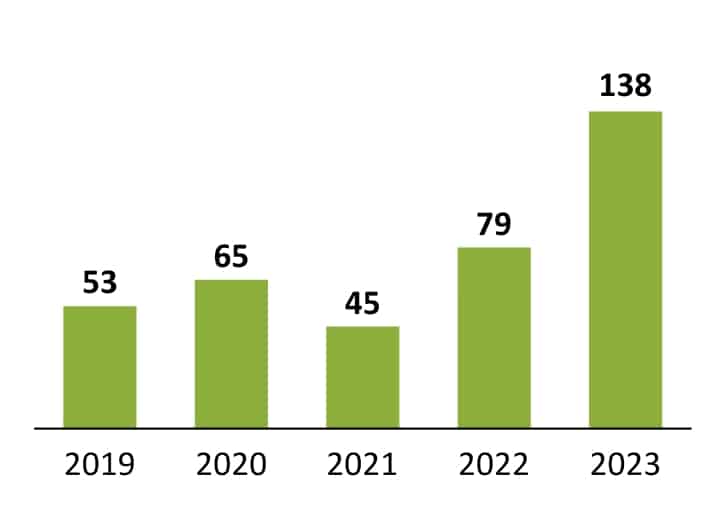
CAPEX
| Amounts in EUR thousand | 2023 | 2022 | 2021 | 2020 | 2019 |
|---|---|---|---|---|---|
| Revenue | 1,627,724 | 1,426,008 | 1,054,203 | 908,417 | 958,016 |
| Gross Profit | 226,441 | 145,314 | 108,673 | 103,513 | 98,514 |
| Gross Profit margin (%) | 13.9% | 10.20% | 10.3% | 11.4% | 10.3% |
| a- EBITDA | 213,785 | 136,809 | 104,140 | 101,995 | 90,098 |
| a-EBITDA margin (%) | 13.1% | 9.60% | 9.9% | 11.2% | 9.4% |
| EBITDA | 199,228 | 133,630 | 85,203 | 91,315 | 90,273 |
| EBITDA margin (%) | 12.2% | 9.40% | 8.1% | 10.1% | 9.4% |
| EBIT | 169,339 | 106,418 | 59,498 | 67,244 | 63,117 |
| EBIT margin (%) | 10.4% | 7.50% | 5.6% | 7.4% | 6.6% |
| Net finance costs | (73,982) | (36,462) | (28,985) | (31,640) | (34,626) |
| Profit before income tax | 95,357 | 69,957 | 30,513 | 35,604 | 28,492 |
| Margin before income tax (%) | 4.5% | 4.9% | 2.1% | 2.7% | 3.0% |
| Profit of the year | 72,958 | 60,420 | 22,079 | 24,922 | 20,177 |
| Profit attributable to owners of the Company | 72,955 | 60,417 | 22,077 | 24,923 | 20,189 |
| Amounts in EUR thousand | 2023 | 2022 | 2021 | 2020 | 2019 |
|---|---|---|---|---|---|
| ASSETS | |||||
| Property, plant and equipment | 627,459 | 526,156 | 476,458 | 457,937 | 422,066 |
| Intangible assets | 36,191 | 31,957 | 31,254 | 29,323 | 24,773 |
| Equity - accounted investees | 34,202 | 40,959 | 36,431 | 34,539 | 34,583 |
| Other non-current assets | 23,345 | 21,511 | 15,622 | 17,089 | 15,390 |
| Non-current assets | 721,196 | 620,582 | 559,765 | 538,889 | 496,812 |
| Inventories | 444,360 | 507,545 | 284,025 | 213,192 | 228,495 |
| Trade and other receivables | 243,579 | 192,769 | 132,040 | 112,872 | 112,577 |
| Contract assets | 227,203 | 195,481 | 98,217 | 64,875 | 118,573 |
| Cash and cash equivalents | 183,400 | 167,160 | 129,606 | 81,035 | 90,408 |
| Other current assets | 19,420 | 15,209 | 2,298 | 1,129 | 760 |
| Current assets | 1,117,962 | 1,078,163 | 646,185 | 473,103 | 550,814 |
| TOTAL ASSETS | 1,839,158 | 1,698,745 | 1,205,950 | 1,011,992 | 1,047,626 |
| EQUITY | 405,078 | 341,631 | 277,541 | 254,887 | 231,862 |
| LIABILITIES | |||||
| Loans and borrowings | 208,414 | 127,161 | 174,941 | 174,625 | 177,729 |
| Lease liabilities | 6,244 | 2,233 | 2,080 | 3,681 | 3,990 |
| Deferred tax liabilities | 43,332 | 35,318 | 38,382 | 32,359 | 22,985 |
| Other non-current liabilities | 30,284 | 28,427 | 28,615 | 29,151 | 29,395 |
| Non-current liabilities | 288,273 | 193,139 | 244,017 | 239,816 | 234,100 |
| Loans and borrowings | 343,962 | 474,749 | 215,699 | 231,592 | 320,827 |
| Lease liabilities | 2,352 | 1,224 | 1,216 | 1,752 | 1,768 |
| Trade and other payables | 519,926 | 549,283 | 422,622 | 249,092 | 213,794 |
| Contract liabilities | 252,627 | 108,780 | 26,009 | 30,196 | 43,528 |
| Other current liabilities | 26,940 | 29,940 | 18,846 | 4,657 | 1,746 |
| Current liabilities | 1,145,807 | 1,163,975 | 684,392 | 517,289 | 581,663 |
| TOTAL LIABILITIES | 1,434,080 | 1,357,114 | 928,409 | 757,105 | 815,763 |
| TOTAL EQUITY & LIABILITIES | 1,839,158 | 1,698,745 | 1,205,950 | 1,011,992 | 1,047,626 |